VISUALIZE (more) DATA
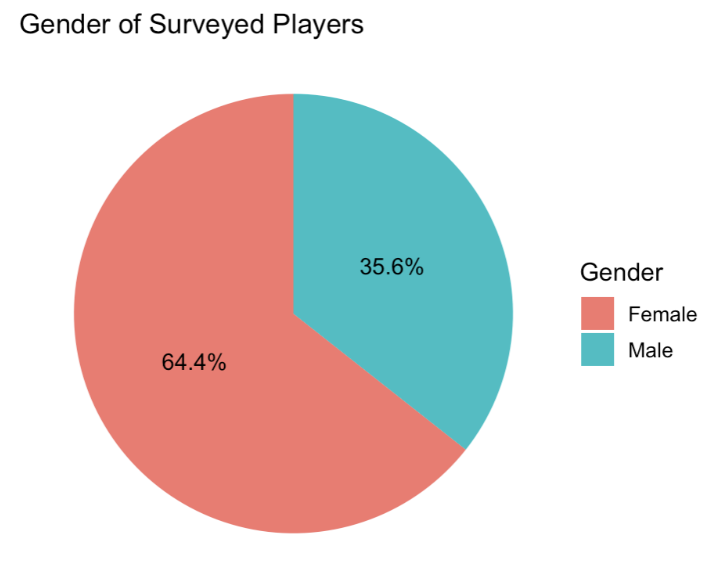
This pie chart, developed using RStudio, is meant to demonstrate the ratio of female players compared to male players who filled out the survey. While it may seem like it speaks for itself, this visualization is crucial in understanding how the gender distribution might influence our analysis of in-game behavior and its relationship to real-life perceptions. This chart helps us identify any potential gender imbalances within the dataset and informs our understanding of how gender dynamics might influence game play. An important factor to note is that the majority of respondents are female, which is interesting considering that historically, video games have been perceived as a predominantly male-dominated space. A high proportion of female players challenges the stereotype and reflects a growing diversity within the gaming community.
This reflects how in turn, there is an increase in the importance of game developers and research to understanding the evolving demographics of players and respond with more inclusive and representative gaming experiences. In addition, the increasing presence of female players in the industry may reflect the need and market potential for games that cater to their preferences and interests, which leads to the generation of more diverse game genres and narratives like those in Animal Crossing. In addition, the higher ratio of female players could lead to shifts in community norms and social dynamics, including communication styles, decision-making, and interaction patterns. Exploring and understanding these shifting dynamics can help us analyze how gender influences online social behavior and gaming culture. At this stage of the visualization process, we have completed our data cleaning to ensure the accuracy of our dataset visuals. However, we may still fine-tune the style of the chart to enhance visual appeal. Once it is finalized, we will integrate it into our narrative to demonstrate our explorations of gender dynamics in gameplay behavior.
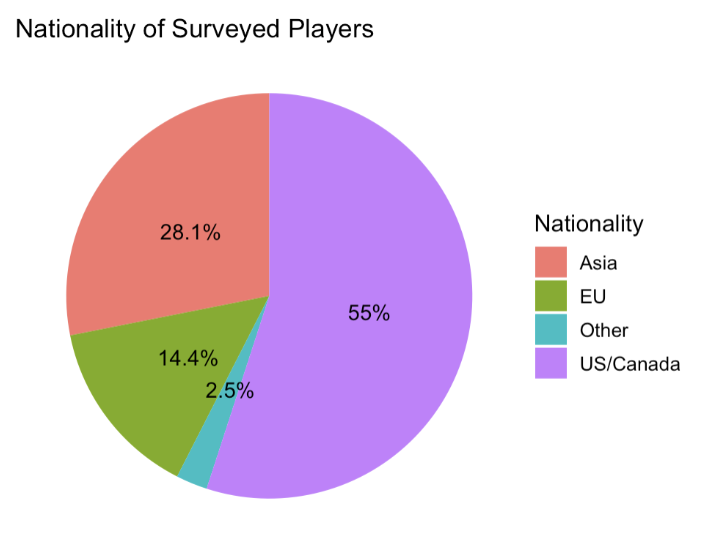
Since our data is considered a multinational dataset, we chose to use a pie chart to display the different nationalities of the people who filled out the survey. We chose R Studio because it has a “pie chart” feature to create pie charts easily and quickly. Although players from 29 different countries filled out this form, their nationalities were grouped together in this chart largely based on continent. While this visualization serves as a simple way to show the demographic breakdown of those who filled out the survey, it simultaneously serves as a warning that the study’s results may not be applicable to all groups. This dataset is not as multinational as one might think, as the US and Canada were largely overrepresented, and there may be lingering cultural differences that were not accounted for. In this survey alone, over half of the participants had American or Canadian nationality, so the results may not apply when studying, for example, gameplay behavior in German players. For our narrative, factors like nationality and country of residence are incredibly important when working with variables like COVID-19 concern. Every country had their own quarantine restrictions and various cultural norms resulted in people having conflicting attitudes towards COVID. In terms of the data visualization process, we have completed data cleaning for the nationality variable and have checked for anomalies. The last piece would be to possibly clean up our styling of the pie chart in case there were any color or text accessibility changes that need to be made.
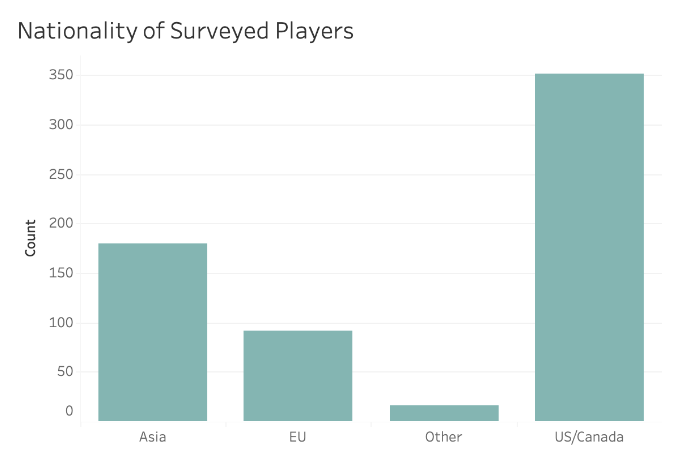
We used Tableau for the second graph because it’s a simple graph easily completed on the platform. The premise of the dataset was to help provide policymakers, game producers, and researchers with valuable resources for understanding the interactions between the behaviors of players’ in the virtual world and their environmental perceptions. The creators wanted to ensure that companies could produce video games in compliance with the United Nations Sustainable Development goals most likely to spread environmental awareness. However, the clear dominance of individuals from US/Canada begs the question on whether this dataset is truly representative of the global population. While the dataset would still provide adequate information between players’ in-game behaviors and their environmental worldviews, the biases of the Western sphere would have a heavier influence on video games’ UN compliance design.
